Local Market UpdatesUncategorized January 11, 2019

Local Market Update – January


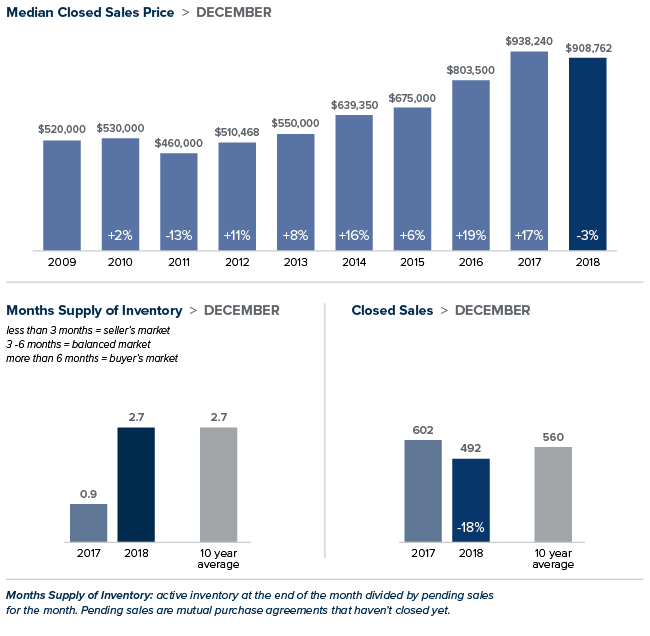
A cool-down in prices and a surge in inventory spelled out good news for buyers in December. Median home prices throughout the region continued to moderate. The number of homes for sale more than doubled over a year ago. Condo inventory more than quadrupled. While we’re still far short of the four to six months that are considered a balanced market, December moved us closer in that direction. As winter months traditionally bring slower sales and lower prices, we’ll be able to determine a more solid trend when the peak real estate season comes this spring.

Eastside

>>>Click image to view full report.

The number of single-family homes and condos on the market in December tripled as compared to a year ago on the Eastside. With an abundance of choices for buyers, homes here took longer to sell. However, well-priced homes still sold within weeks rather than days, which was the case earlier in the year. As with all of King County, home prices here continued to moderate. The median price of a single-family home was $909,000. That’s down 3 percent from a year ago, but up from November’s median price of $885,000.

King County

>>>Click image to view full report.

In December, the median price of a single-family King County home was $639,000. That is 0.6 percent more than the same time last year and a welcome respite from the double-digit increases we saw for much of 2018. Inventory was up as well, soaring 143 percent from a year prior. The trend toward a more balanced market is good news for buyers. Instead of having to make a decision in a matter of hours, buyers now can take the time to consider their options and negotiate a price and terms that work best for them.

Seattle

>>>Click image to view full report.

Last December there were only 299 homes on the market in Seattle. This December there were 1,111. Despite the sharp uptick, Seattle has the tightest inventory in King County with less than two months of supply. Demand is predicted to stay high in 2019. With an abundance of high-paying jobs and not enough people to fill them, Seattle’s population is expected to grow at twice the national rate this year. Prices have continued to moderate from the unsustainable increases of last year. The median price of a single-family home inched up 2 percent from the year prior to $739,000.

Snohomish County

>>>Click image to view full report.

The median price of a single-family home was up 4 percent from last year to $470,000 in December – the same price the area posted the previous month. Inventory has more than doubled in the past year due to more sellers listing their homes and fewer sales. However, at 2.6 months of supply the area has a long way to go before becoming a balanced market.

This post originally appeared on the WindermereEastside.com Blog.

Housing Market NewsLocal Market UpdatesSelling Your HomeUncategorized November 13, 2018

Market Update – November 2018


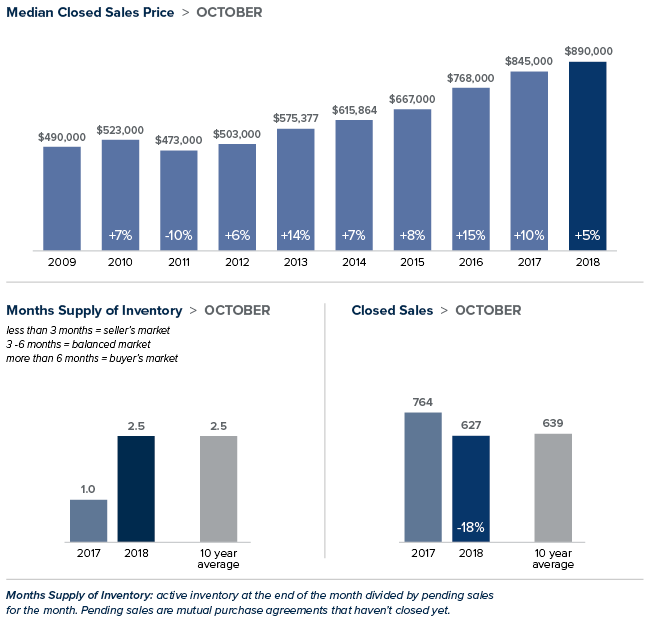
Increased inventory, slower sales and more price reductions all point to a balancing market—welcome news for price-shocked buyers. Sales prices are up from last October and down from the all-time high reached this spring. Despite the slowdown, it’s important to point out that we’re only moving back toward what a normal market looks like. King and Snohomish counties each have over two months of available inventory. While that is double the inventory of a year ago, it’s far short of the four to six months supply that is considered a balanced market. Sellers looking to list their home now can be sure there remains plenty of interest among home buyers.

Eastside

>>>Click image to view full report.

The median home on the Eastside sold for $890,000 in October, up 5 percent from a year ago and unchanged from the previous month. While year-over-year price increases were in the single digits for the Eastside overall, several areas, including Kirkland, Woodinville and Mercer Island, experienced double-digit price gains. Buyers are still having to pay a premium for desirable Eastside properties. However, with more choices and less buyer urgency, sellers need to price their home correctly to maximize their chances of getting the best possible return.

King County

>>>Click image to view full report.

Inventory in King County for all homes, both single-family and condominium, soared 102 percent over last October. The increase was due to an influx of new listings and the fact that homes are now taking longer to sell than at the peak of the market this spring. While buyers now have more breathing room to make their decisions, the 2.4 months of inventory in King County is still far from a balanced market. The median price of a single-family home in October was $670,999, an increase of 7 percent from the same time last year, and virtually unchanged from August and September. South King County showed larger increases, with prices rising more than 10 percent from a year ago in Auburn, Kent and Renton.

Seattle

>>>Click image to view full report.

In October, the median price of a single-family home in Seattle was $750,000, up 2 percent from last October and down slightly from last month. While inventory doubled over a year ago, Seattle falls behind most areas of King County in supply with just under two months of inventory available. Demand is predicted to stay high, with Seattle’s population projected to grow at twice the national rate next year. That said, buyers are in the position to be able to negotiate. A recent analysis named Seattle as one of the top markets in the country where it makes the most sense to buy this winter.

Snohomish County

>>>Click image to view full report.

Inventory in Snohomish County soared 65 percent in October as compared to a year ago. The area now has 2.4 months of inventory, about the same relative supply as King County. As with most of the Puget Sound area, the increase in inventory was due to a higher number of sellers listing their homes and fewer sales. Year-over-year, the median price of a single-family home sold in October in Snohomish County grew 8 percent to $473,000. The median price in September was $485,000.

This post originally appeared on the Windermere Eastside Blog.

Home BuyingHousing Market NewsLocal Market UpdatesSelling Your HomeUncategorized October 29, 2018

The Gardner Report – Third Quarter 2018

The following analysis of the Western Washington real estate market is provided by Windermere Real Estate Chief Economist Matthew Gardner. We hope that this information may assist you with making better-informed real estate decisions. For further information about the housing market in your area, please don’t hesitate to contact your Windermere Agent. 

Economic Overview

Washington State continues to be one of the fastest growing states in the nation and there is little to suggest that there will be any marked slowdown in the foreseeable future. Over the past year, the state has added 105,900 new jobs, representing an annual growth rate of 3.2%. This remains well above the national rate of 1.65%. Private sector employment gains continue to be robust, increasing at an annual rate of 3.7%. The strongest growth sectors were Construction (+7.4%), Information (+6.2%), and Professional & Business Services (+6.1%). The state’s unemployment rate was 4.5%, down from 4.8% a year ago.

All year I’ve been predicting that Washington State’s annual job growth would outperform the nation as a whole, and we now know with certainty that this is going to be the case. Furthermore, I am now able to predict that statewide job growth in 2019 will be equally strong, with an expected increase of 2.6%.

Home Sales Activity

  • There were 22,310 home sales during the third quarter of 2018. This is a significant drop of 12.7% compared to the third quarter of 2017.

  • The number of homes for sale last quarter was up 14.5% compared to the third quarter of 2017, continuing a trend that started earlier in the year. However, the increase in listings was only in Seattle’s tri-county area (King, Pierce, and Snohomish Counties) while listing activity was down across the balance of the region.

  • Only two counties had a year-over-year increase in home sales, while the rest of Western Washington saw sales decrease.

  • The region has reached an inflection point. With the increase in the number of homes for sale, buyers now have more choices and time to make​ a decision about what home to buy.

Home Prices

  • Home prices, although higher than a year ago, continue to slow due to the significant increase in the number of homes for sale. This, in my opinion, is a very good thing.​​

  • When compared to the same period a year ago, price growth was strongest in Lewis County, where home prices were up 15.3%. Six other counties experienced double-digit price increases.

  • Slowing price growth was inevitable; we simply could not sustain the increases we’ve experienced in recent years. Lower rates of appreciation will continue until wage growth catches up.

Days on Market

  • The average number of days it took to sell a home dropped by four days compared to the same quarter of 2017.

  • Across the entire region, it took an average of 39 days to sell a home in the third quarter of this year. This is down from 43 days in the third quarter of 2017 and down 2 days when compared to the second quarter of 2018.​
  • King County continues to be the tightest market in Western Washington, with homes taking an average of only 19 days to sell. Every county in the region other than Skagit and King — which both saw the time on the market rise by 2 days — saw the length of time it took to sell a home drop when compared to the same period a year ago.

  • More choice in the market would normally suggest that the length of time it takes to sell a home should rise, but the data has yet to show that. That said, compared to last quarter, we are seeing some marked increases in days on market in several counties, which will be reflected in future reports.

Conclusions

This speedometer reflects the state of the region’s real estate market using housing inventory, price gains, home sales, interest rates, and larger economic factors. I started to move the needle toward buyers last quarter and have moved it even further this quarter. Price growth continues to slow, but more significant is the rise in listings, which I expect to continue as we move toward the quieter winter period.

I believe that psychology will start to play a part in the housing market going forward. It has been more than 15 years since we’ve experienced a “balanced” market, so many home buyers and sellers have a hard time remembering what one looks like. Concerns over price drops are overrated and the length of time it’s taking to sell a home is simply trending back to where it used to be in the early 2000s.


Matthew Gardner is the Chief Economist for Windermere Real Estate, specializing in residential market analysis, commercial/industrial market analysis, financial analysis, and land use and regional economics. He is the former Principal of Gardner Economics, and has more than 30 years of professional experience both in the U.S. and U.K.


This post originally appeared on the Windermere.com Blog.

Housing Market NewsLocal Market UpdatesSelling Your HomeUncategorized October 10, 2018

Market Update – October 2018


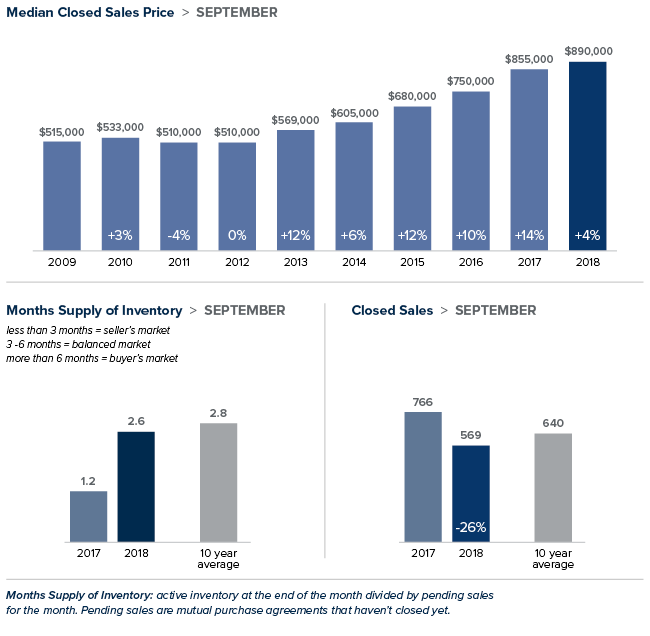
It appears that balance is slowly returning to the local housing market. Home price growth slowed in September. Inventory continued to climb, but is still far short of the four to six months that indicate a normal market. Homes are staying on the market longer, giving buyers the breathing room to make the right choice for their situation. With our region’s healthy job growth, and demand still exceeding supply, it’s likely to take some time to move to a fully balanced market.

Eastside

>>>Click image to view full report.

Home price increases moderated into the single-digits in September. The median price of a single-family home on the Eastside was up 4 percent from the same time last year to $890,0000 but down from a median price of $935,000 in August. Inventory increased significantly and price drops jumped. While the market is softening, the recent expanded presence of Google and Facebook on the Eastside means demand should stay strong. In addition, the area’s excellent school system continues to be a large draw for buyers both locally and internationally.

King County

>>>Click image to view full report.

Inventory was up 68 percent year-over-year in King County due to a higher number of sellers listing their homes and fewer sales. There is now more than two months of inventory in the county, a number we haven’t seen in nearly four years. Despite the increase, there is a long way to go to reach the four to six months of inventory that is considered balanced. In September, the median price of a single-family home was $668,000; an increase of 7 percent from the same time last year and virtually unchanged from August.

Seattle

>>>Click image to view full report.

Inventory in Seattle surged in September from a year ago. Only San Jose, CA saw the number of homes for sale rise faster than Seattle last month. The median home price in September was $775,000. Up slightly from the $760,000 median price in August and a 7 percent increase from last year. The double-digit price growth of past years appear to be waning and overzealous sellers who listed their homes at unrealistically high prices have been forced to reduce them. Bidding wars have declined and the typical well-priced house is now selling right at asking price.

Snohomish County

>>>Click image to view full report.

While not nearly as dramatic as the case in King County, inventory in Snohomish County was up 40 percent. The area has just over two months of inventory with home prices moderating. The median price of a single-family home increased 8 percent over a year ago to $485,000. That’s down from the $492,000 median reached in August and $26,000 less than the peak of the market reached in spring.

This post originally appeared on the WindermereEastside.com Blog.