
 Facebook
 Twitter
 Pinterest
 Copy Link


 As Chief Economist for Windermere Real Estate, Matthew Gardner is responsible for analyzing and interpreting economic data and its impact on the real estate market on both a local and national level. Matthew has over 30 years of professional experience both in the U.S. and U.K.


The following analysis of the Western Washington real estate market is provided by Windermere Real Estate Chief Economist Matthew Gardner. We hope that this information may assist you with making better-informed real estate decisions. For further information about the housing market in your area, please don’t hesitate to contact your Windermere Agent.
Economic Overview
Washington State continues to be one of the fastest growing states in the nation and there is little to suggest that there will be any marked slowdown in the foreseeable future. Over the past year, the state has added 105,900 new jobs, representing an annual growth rate of 3.2%. This remains well above the national rate of 1.65%. Private sector employment gains continue to be robust, increasing at an annual rate of 3.7%. The strongest growth sectors were Construction (+7.4%), Information (+6.2%), and Professional & Business Services (+6.1%). The state’s unemployment rate was 4.5%, down from 4.8% a year ago.
All year I’ve been predicting that Washington State’s annual job growth would outperform the nation as a whole, and we now know with certainty that this is going to be the case. Furthermore, I am now able to predict that statewide job growth in 2019 will be equally strong, with an expected increase of 2.6%.
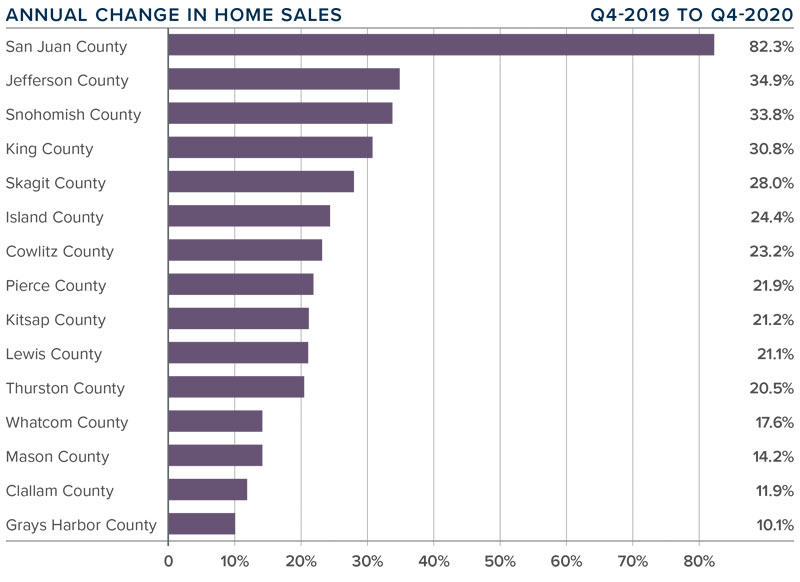
Home Sales Activity
-
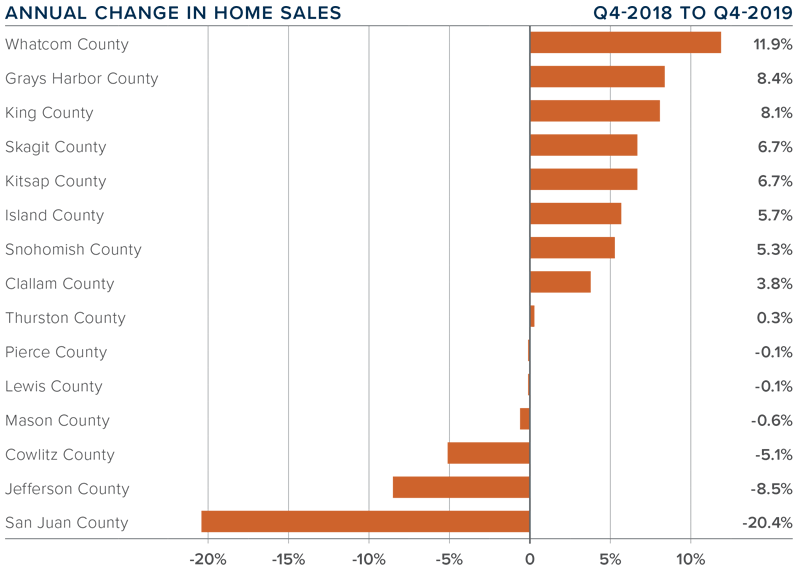
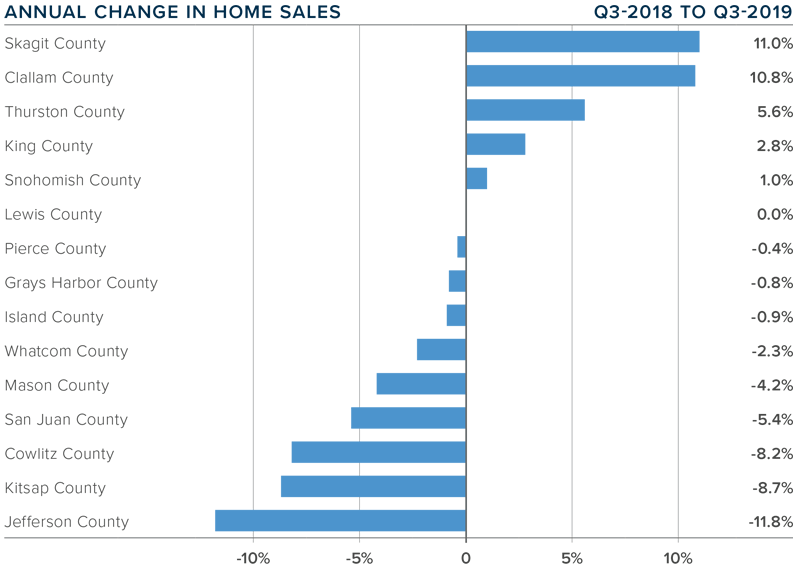
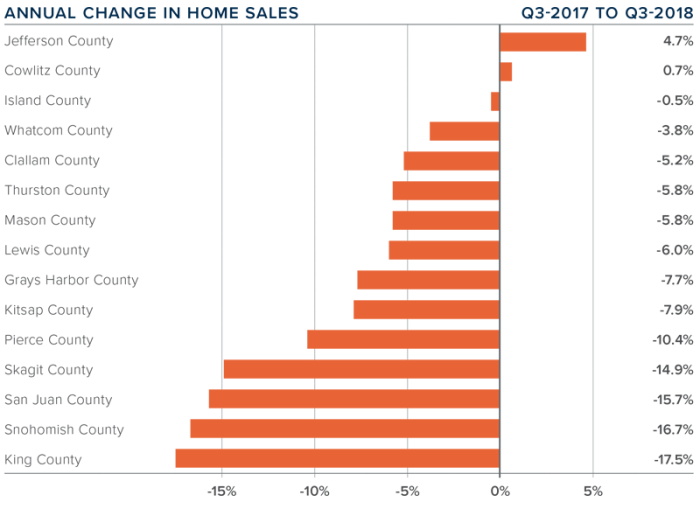
There were 22,310 home sales during the third quarter of 2018. This is a significant drop of 12.7% compared to the third quarter of 2017.
-
The number of homes for sale last quarter was up 14.5% compared to the third quarter of 2017, continuing a trend that started earlier in the year. However, the increase in listings was only in Seattle’s tri-county area (King, Pierce, and Snohomish Counties) while listing activity was down across the balance of the region.
-
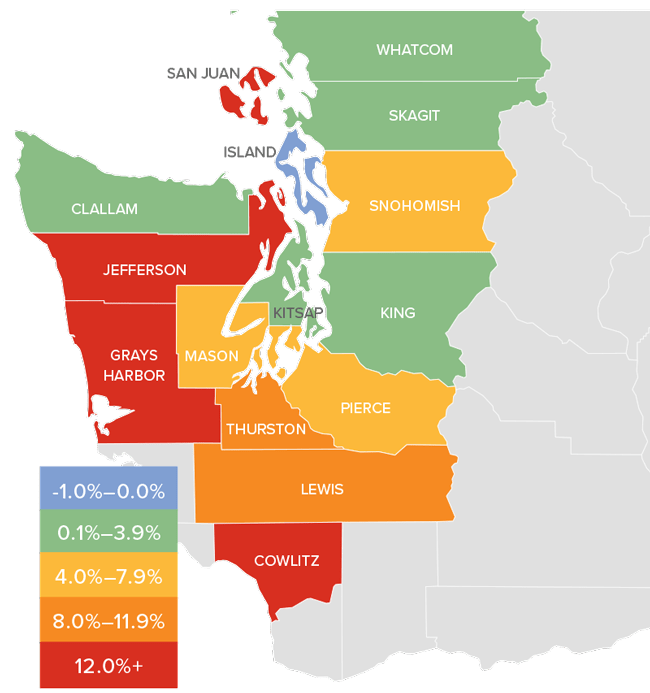
Only two counties had a year-over-year increase in home sales, while the rest of Western Washington saw sales decrease.
-
The region has reached an inflection point. With the increase in the number of homes for sale, buyers now have more choices and time to make a decision about what home to buy.
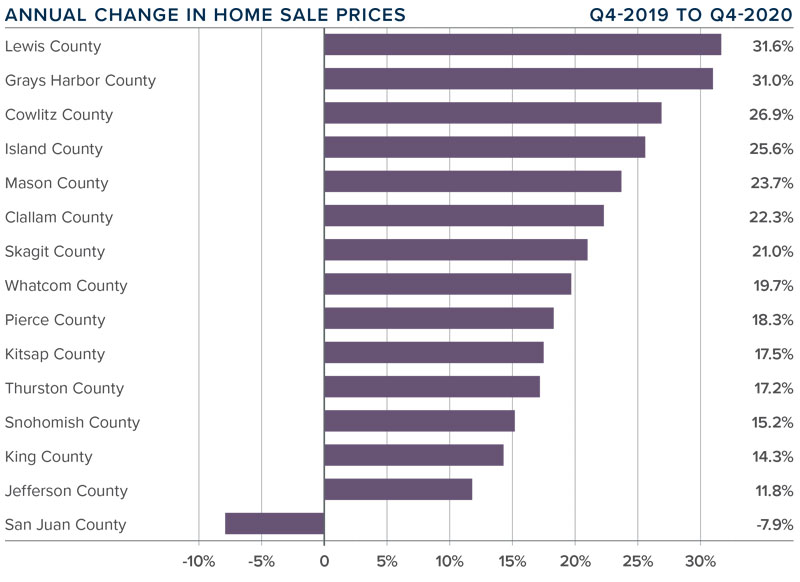
Home Prices
-
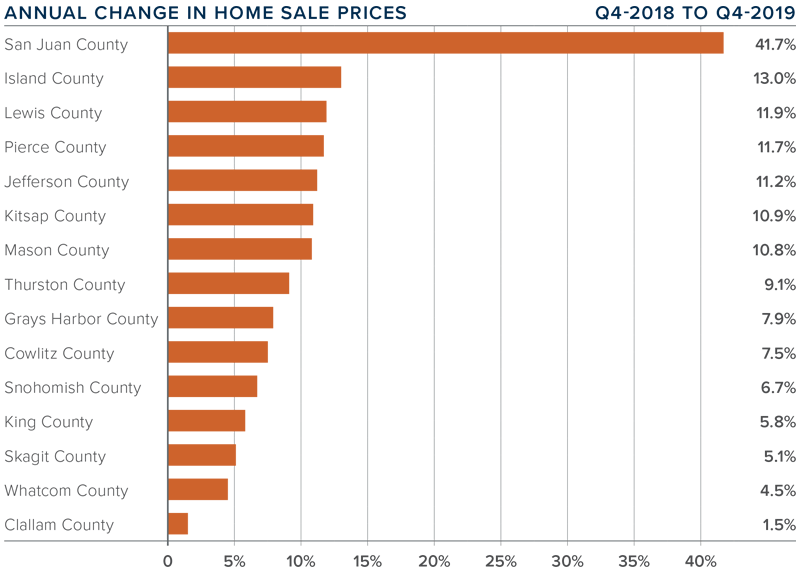
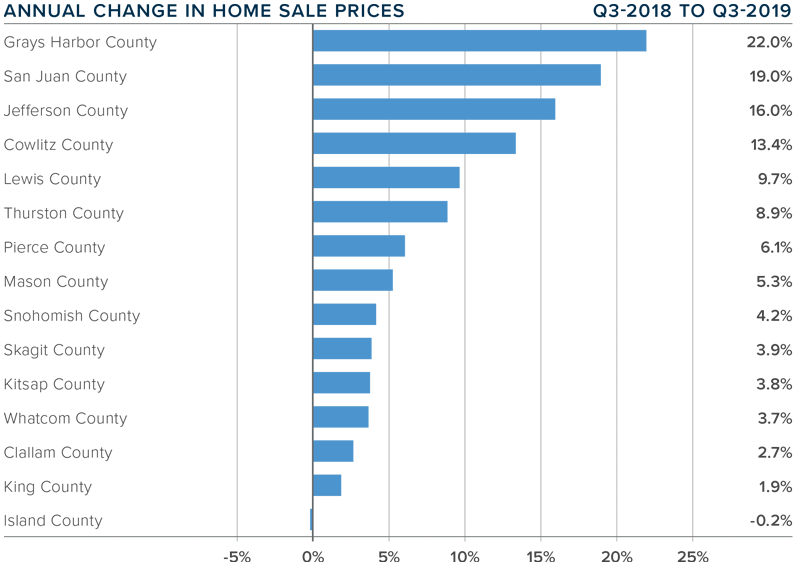
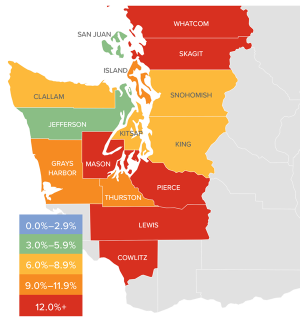 As inventory levels start to rise, some of the heat has been taken off the market, which caused home prices in the Western Washington region to go up by a relatively modest 6.2% over last year to $503,039. Notably, prices are down by 4.4% when compared to the second quarter of this year.
 -
Home prices, although higher than a year ago, continue to slow due to the significant increase in the number of homes for sale. This, in my opinion, is a very good thing.
-
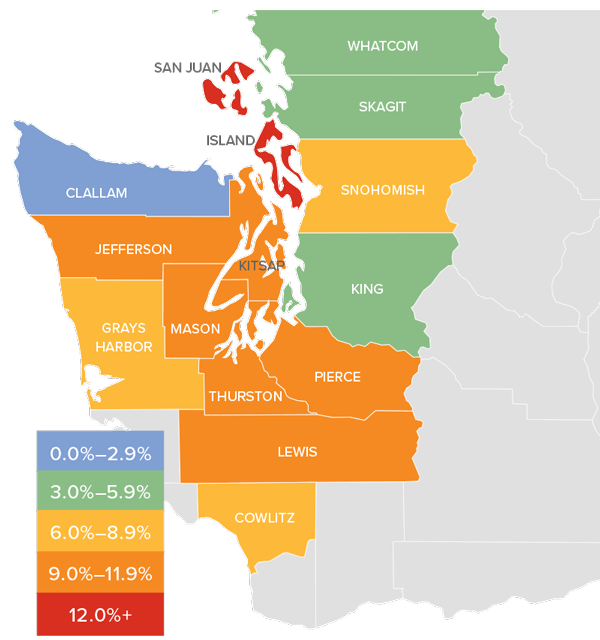
When compared to the same period a year ago, price growth was strongest in Lewis County, where home prices were up 15.3%. Six other counties experienced double-digit price increases.
-
Slowing price growth was inevitable; we simply could not sustain the increases we’ve experienced in recent years. Lower rates of appreciation will continue until wage growth catches up.

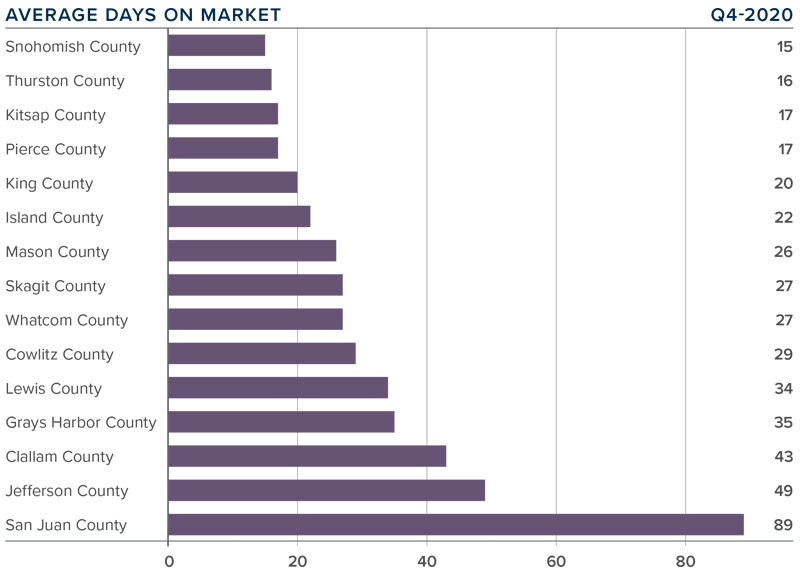
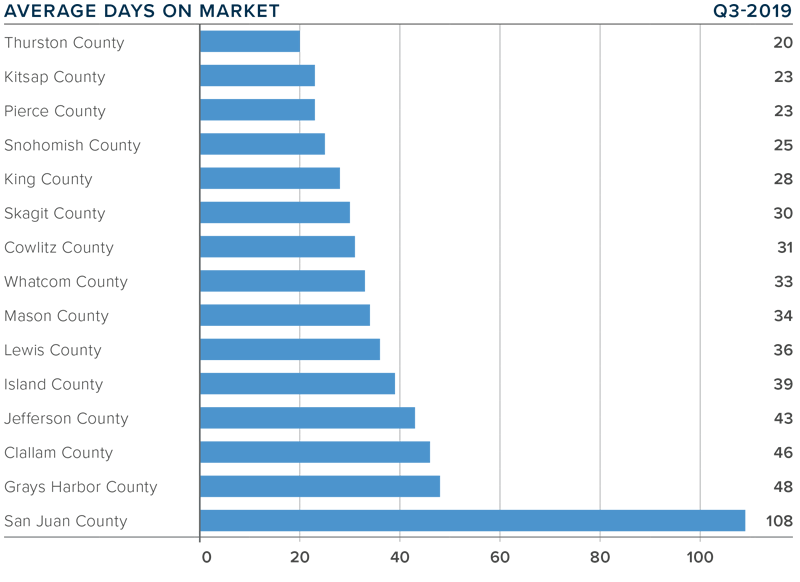
Days on Market
-
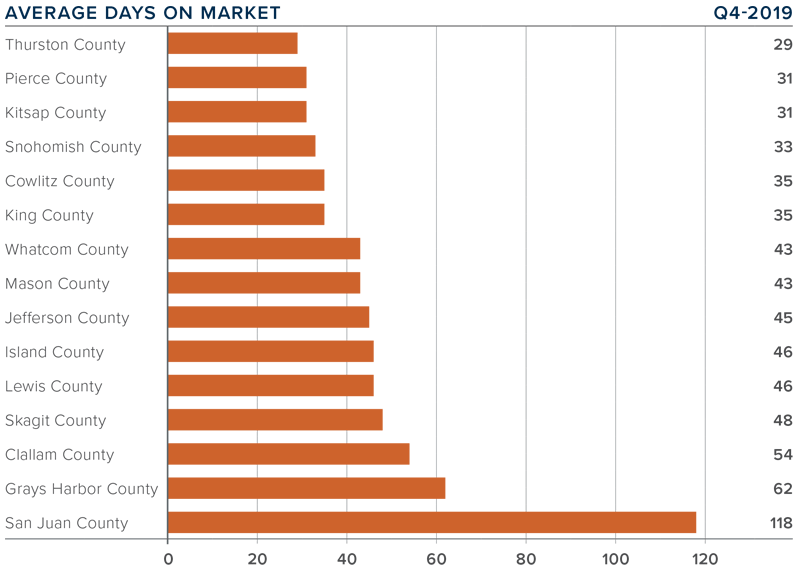
The average number of days it took to sell a home dropped by four days compared to the same quarter of 2017.
- Across the entire region, it took an average of 39 days to sell a home in the third quarter of this year. This is down from 43 days in the third quarter of 2017 and down 2 days when compared to the second quarter of 2018.
-
King County continues to be the tightest market in Western Washington, with homes taking an average of only 19 days to sell. Every county in the region other than Skagit and King — which both saw the time on the market rise by 2 days — saw the length of time it took to sell a home drop when compared to the same period a year ago.
-
More choice in the market would normally suggest that the length of time it takes to sell a home should rise, but the data has yet to show that. That said, compared to last quarter, we are seeing some marked increases in days on market in several counties, which will be reflected in future reports.

Conclusions

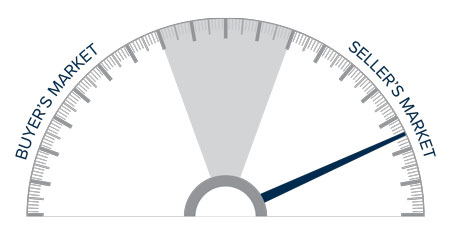
This speedometer reflects the state of the region’s real estate market using housing inventory, price gains, home sales, interest rates, and larger economic factors. I started to move the needle toward buyers last quarter and have moved it even further this quarter. Price growth continues to slow, but more significant is the rise in listings, which I expect to continue as we move toward the quieter winter period.
I believe that psychology will start to play a part in the housing market going forward. It has been more than 15 years since we’ve experienced a “balanced” market, so many home buyers and sellers have a hard time remembering what one looks like. Concerns over price drops are overrated and the length of time it’s taking to sell a home is simply trending back to where it used to be in the early 2000s.

Matthew Gardner is the Chief Economist for Windermere Real Estate, specializing in residential market analysis, commercial/industrial market analysis, financial analysis, and land use and regional economics. He is the former Principal of Gardner Economics, and has more than 30 years of professional experience both in the U.S. and U.K.
This post originally appeared on the Windermere.com Blog.
