Home BuyingHousing Market NewsLocal Market UpdatesSelling Your HomeUncategorized October 29, 2018

The Gardner Report – Third Quarter 2018

The following analysis of the Western Washington real estate market is provided by Windermere Real Estate Chief Economist Matthew Gardner. We hope that this information may assist you with making better-informed real estate decisions. For further information about the housing market in your area, please don’t hesitate to contact your Windermere Agent. 

Economic Overview

Washington State continues to be one of the fastest growing states in the nation and there is little to suggest that there will be any marked slowdown in the foreseeable future. Over the past year, the state has added 105,900 new jobs, representing an annual growth rate of 3.2%. This remains well above the national rate of 1.65%. Private sector employment gains continue to be robust, increasing at an annual rate of 3.7%. The strongest growth sectors were Construction (+7.4%), Information (+6.2%), and Professional & Business Services (+6.1%). The state’s unemployment rate was 4.5%, down from 4.8% a year ago.

All year I’ve been predicting that Washington State’s annual job growth would outperform the nation as a whole, and we now know with certainty that this is going to be the case. Furthermore, I am now able to predict that statewide job growth in 2019 will be equally strong, with an expected increase of 2.6%.

Home Sales Activity

  • There were 22,310 home sales during the third quarter of 2018. This is a significant drop of 12.7% compared to the third quarter of 2017.

  • The number of homes for sale last quarter was up 14.5% compared to the third quarter of 2017, continuing a trend that started earlier in the year. However, the increase in listings was only in Seattle’s tri-county area (King, Pierce, and Snohomish Counties) while listing activity was down across the balance of the region.

  • Only two counties had a year-over-year increase in home sales, while the rest of Western Washington saw sales decrease.

  • The region has reached an inflection point. With the increase in the number of homes for sale, buyers now have more choices and time to make​ a decision about what home to buy.

Home Prices

  • Home prices, although higher than a year ago, continue to slow due to the significant increase in the number of homes for sale. This, in my opinion, is a very good thing.​​

  • When compared to the same period a year ago, price growth was strongest in Lewis County, where home prices were up 15.3%. Six other counties experienced double-digit price increases.

  • Slowing price growth was inevitable; we simply could not sustain the increases we’ve experienced in recent years. Lower rates of appreciation will continue until wage growth catches up.

Days on Market

  • The average number of days it took to sell a home dropped by four days compared to the same quarter of 2017.

  • Across the entire region, it took an average of 39 days to sell a home in the third quarter of this year. This is down from 43 days in the third quarter of 2017 and down 2 days when compared to the second quarter of 2018.​
  • King County continues to be the tightest market in Western Washington, with homes taking an average of only 19 days to sell. Every county in the region other than Skagit and King — which both saw the time on the market rise by 2 days — saw the length of time it took to sell a home drop when compared to the same period a year ago.

  • More choice in the market would normally suggest that the length of time it takes to sell a home should rise, but the data has yet to show that. That said, compared to last quarter, we are seeing some marked increases in days on market in several counties, which will be reflected in future reports.

Conclusions

This speedometer reflects the state of the region’s real estate market using housing inventory, price gains, home sales, interest rates, and larger economic factors. I started to move the needle toward buyers last quarter and have moved it even further this quarter. Price growth continues to slow, but more significant is the rise in listings, which I expect to continue as we move toward the quieter winter period.

I believe that psychology will start to play a part in the housing market going forward. It has been more than 15 years since we’ve experienced a “balanced” market, so many home buyers and sellers have a hard time remembering what one looks like. Concerns over price drops are overrated and the length of time it’s taking to sell a home is simply trending back to where it used to be in the early 2000s.


Matthew Gardner is the Chief Economist for Windermere Real Estate, specializing in residential market analysis, commercial/industrial market analysis, financial analysis, and land use and regional economics. He is the former Principal of Gardner Economics, and has more than 30 years of professional experience both in the U.S. and U.K.


This post originally appeared on the Windermere.com Blog.

For Your HomeHome BuyingHousing Market NewsLocal Market UpdatesSelling Your HomeUncategorized October 25, 2018

How Interest Rates Affect Buying Power

Whether you are thinking about buying or selling a home, interest rate trends are an important factor to consider. Mortgage interest rates have been rising and experts, including Windermere Chief Economist Matthew Gardner, predict that they will continue to increase in 2019.

Interest Rates and Buying Power

The chart below shows the impact rising interest rates would have if you planned to purchase a $675,000 home while keeping your principal and interest payments at $3,500 a month.

Every time interest rates increase by a quarter of a percent, your buying power decreases by about 3 percent.

What this means for buyers:

With prices moderating and interest rates slated to rise again, now is a good time to buy. If you’re betting on prices falling, you need to consider the strong possibility that an increase in interest rates would offset any potential price savings.

What this means for sellers:

Listing your home now means you will attract a larger buyer pool before interest rates rise.

Whether you’re thinking of buying or selling our brokers can provide you market data that will help you make the best decision for your circumstances. 

This post was originally on the Windermere Eastside Blog.

Housing Market NewsLocal Market UpdatesSelling Your HomeUncategorized October 10, 2018

Market Update – October 2018


It appears that balance is slowly returning to the local housing market. Home price growth slowed in September. Inventory continued to climb, but is still far short of the four to six months that indicate a normal market. Homes are staying on the market longer, giving buyers the breathing room to make the right choice for their situation. With our region’s healthy job growth, and demand still exceeding supply, it’s likely to take some time to move to a fully balanced market.

Eastside

>>>Click image to view full report.

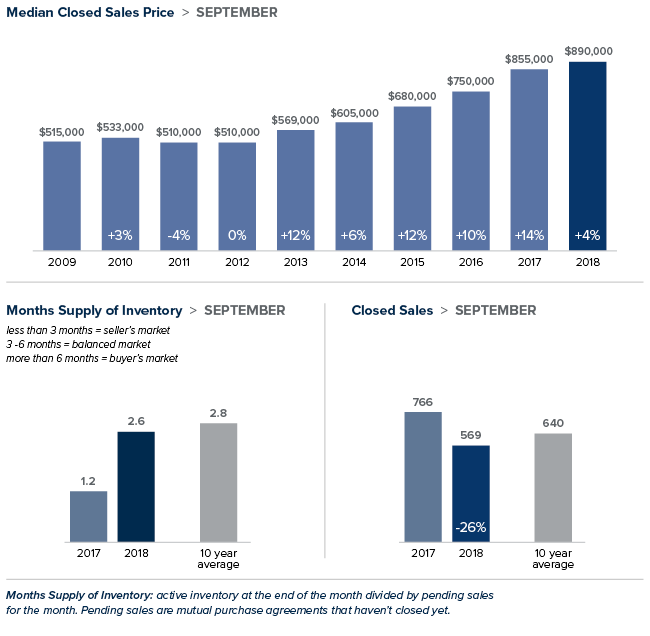
Home price increases moderated into the single-digits in September. The median price of a single-family home on the Eastside was up 4 percent from the same time last year to $890,0000 but down from a median price of $935,000 in August. Inventory increased significantly and price drops jumped. While the market is softening, the recent expanded presence of Google and Facebook on the Eastside means demand should stay strong. In addition, the area’s excellent school system continues to be a large draw for buyers both locally and internationally.

King County

>>>Click image to view full report.

Inventory was up 68 percent year-over-year in King County due to a higher number of sellers listing their homes and fewer sales. There is now more than two months of inventory in the county, a number we haven’t seen in nearly four years. Despite the increase, there is a long way to go to reach the four to six months of inventory that is considered balanced. In September, the median price of a single-family home was $668,000; an increase of 7 percent from the same time last year and virtually unchanged from August.

Seattle

>>>Click image to view full report.

Inventory in Seattle surged in September from a year ago. Only San Jose, CA saw the number of homes for sale rise faster than Seattle last month. The median home price in September was $775,000. Up slightly from the $760,000 median price in August and a 7 percent increase from last year. The double-digit price growth of past years appear to be waning and overzealous sellers who listed their homes at unrealistically high prices have been forced to reduce them. Bidding wars have declined and the typical well-priced house is now selling right at asking price.

Snohomish County

>>>Click image to view full report.

While not nearly as dramatic as the case in King County, inventory in Snohomish County was up 40 percent. The area has just over two months of inventory with home prices moderating. The median price of a single-family home increased 8 percent over a year ago to $485,000. That’s down from the $492,000 median reached in August and $26,000 less than the peak of the market reached in spring.

This post originally appeared on the WindermereEastside.com Blog.

For Your HomeHome BuyingHousing Market NewsLocal Market UpdatesSelling Your HomeUncategorized September 12, 2018

Local Market Update – September 2018


The number of homes for sale in August increased dramatically over the same time a year ago. This is the result of a moderate increase in new listings and a much slower pace of sales. Homes are staying on the market longer, giving buyers more choices and more time to make an informed decision. While home prices are up compared to a year ago, the rate of increase was in the single digits rather than the double-digit surges of past months. It’s still a seller’s market, but sellers need to have realistic expectations about pricing their homes as the market softens.

Eastside

>>>Click image to view full report.

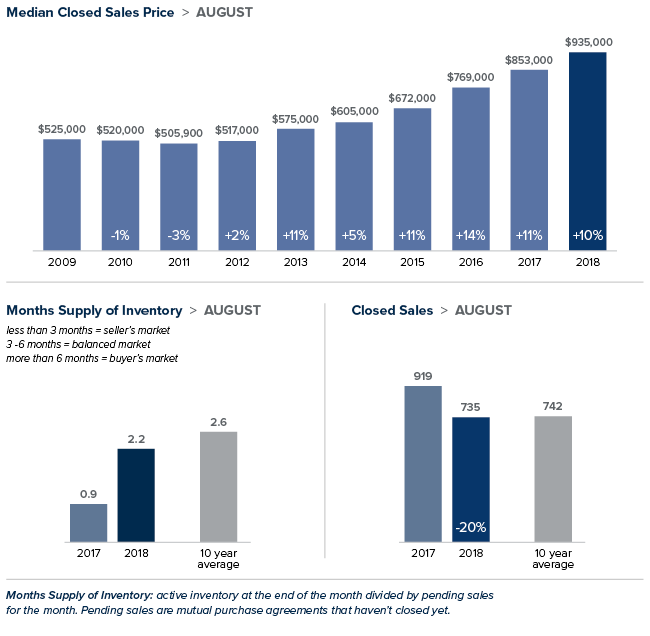
The median price of a single-family home on the Eastside was up nearly 10 percent from the same time last year to $935,000. Home prices have declined each month from the all-time high of $977,759 set in June. Inventory increased 73 percent over last August. With supply soaring and home prices moderating, sellers need to work with their broker to price their home to meet the current market conditions. A year ago 47 percent of the homes on the Eastside sold for over list price. This August that number was down to 29 percent.

King County

>>>Click image to view full report.

King County experienced yet another flood of inventory with the number of homes for sale jumping 65 percent over the previous year. Despite the growth, the county has just 1.9 months of inventory and remains a seller-oriented market. The market has slowed but it remains fast-paced, with 62 percent of the properties here selling in fewer than 15 days. While home prices were up 3 percent from a year ago, the median price of $669,000 represented the third straight month of declines from the record-high of $726,275 reached in May.

Seattle

>>>Click image to view full report.

After leading the nation in home price growth for nearly two years, Seattle is finally cooling off. The median home price in August was $760,000, up just 4 percent from last year and down from the record $830,000 reached in May. Inventory soared in August, but the city still has just two months of supply, far short of the four to six months that is considered balanced. Bidding wars are becoming less common and price drops more common. Sellers must adjust their expectations to what appears to be a long waited moderating of the market.

Snohomish County

>>>Click image to view full report.

Mirroring the market slowdown in King County, Snohomish County also experienced a cooling off in August. The median price of a single-family home was $492,000, up 8 percent from a year ago but down from the record high of $511,000 two months prior. Inventory increased nearly 30 percent, but at just 1.6 months of supply the market remains very tight and sales are brisk. Sixty percent of homes here sold within 15 days.

This post originally appeared on the WindermereEastside.com Blog.

For Your HomeUncategorized August 22, 2018

Avoiding the Pitfalls of Home Addition Construction

When dissatisfaction with your current home strikes, it can be exciting to launch into a plan for a new addition. A new living room, bedroom, or more can add value to your home while improving your quality of life.

On the other hand, even a modest addition can turn into a major construction project, with architects and contractors to manage, construction workers traipsing through your home, hammers pounding, and sawdust everywhere. And although new additions can be a very good investment, the cost-per-square-foot is typically more than building a new home, and much more than buying a larger existing home.


Define your needs

To determine if an addition makes sense for your particular situation, start by defining exactly what it is you want and need. By focusing on core needs, you won’t get carried away with a wish list that can push the project out of reach financially.

If it’s a matter of needing more space, be specific. For example, instead of just jotting down “more kitchen space,” figure out just how much more space is going to make the difference, e.g., “150 square feet of floor space and six additional feet of counter space.”

If the addition will be for aging parents, consult with their doctors or an age-in-place expert to define exactly what they’ll require for living conditions, both now and over the next five to ten years.


Types of additions

Bump-out addition—“Bumping out” one or more walls to make a first-floor room slightly larger is something most homeowners think about at one time or another. However, when you consider the work required, and the limited amount of space created, it often figures to be one of your most expensive approaches.

First-floor addition—Adding a whole new room (or rooms) to the first floor of your home is one of the most common ways to add a family room, apartment or sunroom. But this approach can also take away yard space.

Dormer addition—For homes with steep rooflines, adding an upper floor dormer may be all that’s needed to transform an awkward space with limited headroom. The cost is affordable and, when done well, a dormer can also improve the curb-appeal of your house.

Second-story addition—For homes without an upper floor, adding a second story can double the size of the house without reducing surrounding yard space.

Garage addition—Building above the garage is ideal for a space that requires more privacy, such as a rentable apartment, a teen’s bedroom, guest bedroom, guest quarters, or a family bonus room.


Permits required

You’ll need a building permit to construct an addition—which will require professional blueprints. Your local building department will not only want to make sure that the addition adheres to the latest building codes, but also ensure it isn’t too tall for the neighborhood or positioned too close to the property line. Some building departments will also want to ask your neighbors for their input before giving you the go-ahead.


Requirements for a legal apartment

While the idea of having a renter that provides an additional stream of revenue may be enticing, the realities of building and renting a legal add-on apartment can be sobering. Among the things you’ll need to consider:

  • Special permitting—Some communities don’t like the idea of “mother-in-law” units and therefore have regulations against it or zone-approval requirements.
  • Separate utilities—In many cities, you can’t charge a tenant for heat, electricity, and water unless utilities are separated from the rest of the house (and separately controlled by the tenant).
  • ADU Requirements—When building an “accessory dwelling unit” (the formal name for a second dwelling located on a property where a primary residence already exists), building codes often contain special requirements regarding emergency exists, windows, ceiling height, off-street parking spaces, the location of main entrances, the number of bedrooms, and more.

In addition, renters have special rights while landlords have added responsibilities. You’ll need to learn those rights and responsibilities and be prepared to adhere to them.


Average costs

The cost to construct an addition depends on a wide variety of factors, such as the quality of materials used, the laborers doing the work, the type of addition and its size, the age of your house and its current condition. For ballpark purposes, however, you can figure on spending about $200 per square foot if your home is located in a more expensive real estate area or about $100 per foot in a lower-priced market.

You might be wondering how much of that money your efforts might return if you were to sell the home a couple years later? The answer to that question depends on the aforementioned details, but the average “recoup” rate for a family room addition is typically more than 80 percent.


The bottom line

While you should certainly research the existing-home marketplace before hiring an architect to map out the plans, building an addition onto your current home can be a great way to expand your living quarters, customize your home, and remain in the same neighborhood.

This post originally appeared on the Windermere Blog.

Uncategorized August 10, 2018

Local Market Update – August 2018


For the first time in years, the real estate market is finally starting to deliver good news for buyers. The region experienced its third straight month of significant growth in inventory. Homes are sitting on the market longer, prices are moderating, and multiple offers are becoming more rare. Despite the surge in homes for sale, it is still a seller’s market. Inventory would need to triple to reach what is considered a balanced market.

Eastside

>>>Click image to view full report.

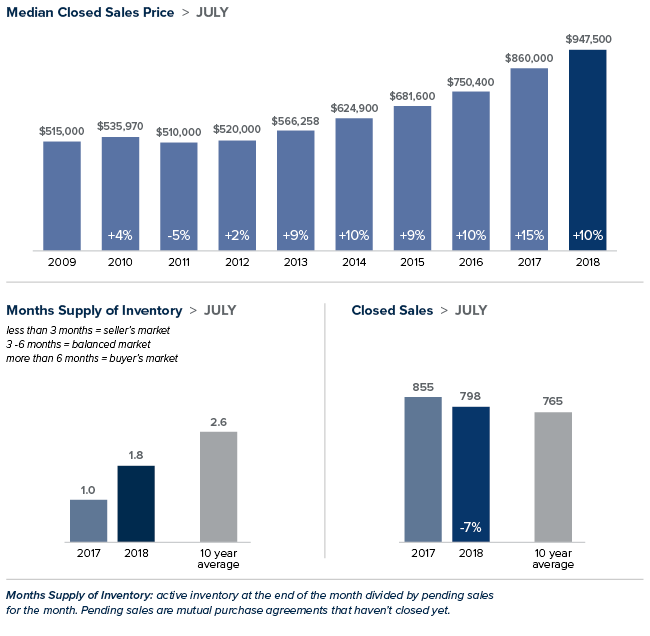
Inventory on the Eastside soared 47 percent over the same time last year. There was a slight increase in new listings, but the jump was mostly due to homes staying on the market longer. Price drops have become more common. With buyers having more choices, sellers need to work with their broker to make sure they price their home correctly the first time. After setting a new high of $977,759 in June, the median price of a single-family home dropped to $947,500 in July. While offering some hope that prices may have started to moderate, the median is still 10 percent higher than it was the same time a year ago.

King County

>>>Click image to view full report.

King County saw the biggest increase in inventory in a decade, with the number of homes for sale jumping 48 percent over a year ago. However, at 1.5 months of supply that’s still well below the 4-6 months of inventory that is considered balanced. The median price of a single-family sold in July was $699,000. That represents an increase of 6 percent from a year ago, but is down 4 percent from the record high of $725,000 set in April. Perceptions that the market is cooling needs to be kept in perspective. Homes here took an average of 15 days to sell.

Seattle

>>>Click image to view full report.

Seattle saw inventory shoot up 60 percent over a year ago, bringing the supply to its highest level in over three years. Even with the sharp increase, much more inventory is needed to meet the demand for homes in the city and sellers may well decide to jump into the market. According to a Zillow study, more than 97 percent of homes in Seattle are worth more now than the peak level before the housing market crashed. Median home prices are 29 percent above the bubble peak level with the median price in July landing at $805,000; up 7 percent from last July and down from the record $830,000 reached in May.

Snohomish County

>>>Click image to view full report.

Snohomish County also had double-digit increases in inventory, though not nearly as great as King County. The number of homes for sale in July increased nearly 16 percent over the same time a year ago, but inventory continues to be very tight. The median price of a single-family home rose 9 percent year-to-year to $495,000. That figure is down from the record high of $511,500 set in June. A move towards a more moderated market is encouraging for buyers and an incentive for sellers to list their homes soon.

This post originally appeared on the WindermereEastside.com Blog.

Uncategorized July 25, 2018

The Gardner Report – Q2 2018

Gardner Report Q2 2018

The following analysis of the Western Washington real estate market is provided by Windermere Real Estate Chief Economist Matthew Gardner. We hope that this information may assist you with making better-informed real estate decisions.

Economic Overview

The Washington State economy added 83,900 new jobs over the past 12 months, representing an annual growth rate of 2.5%. This is a slowdown from the last quarter, but employment growth remains well above the national rate of 1.6%. Employment gains continue to be robust in the private sector, which was up by 2.8%. The public sector (government) grew by a more modest 1.1%.

The strongest growth sectors were Retail Trade and Construction, which both rose by 4.8%. Significant growth was also seen in the Education & Health Services and Information sectors, which rose by 3.9% and 3.4%, respectively.

The State’s unemployment rate was 4.7%, down from 4.8% a year ago. Washington State will continue adding jobs for the balance of the year and I anticipate total job growth for 2018 will be around 80,000, representing a total employment growth rate of 2.4%.

Home Sales Activity

  • There were 23,209 home sales during the second quarter of 2018. This is a drop of 2.3% compared to the same period a year ago.

  • Clallam County saw sales rise the fastest relative to the same period a year ago, with an increase of 12.6%. Jefferson County also saw significant gains in sales at 11.1%.

  • The number of homes for sale last quarter was down by a nominal 0.3% when compared to the second quarter of 2017, but up by 66% when compared to the first quarter of this year. Much has been mentioned regarding the growth in listings, but it was not region-wide. King County saw a massive 31.7% increase in inventory, though all but three of the other counties covered in this report saw the number of listings drop compared to a year ago.

  • The takeaway from this data is that while some counties are seeing growth in listings — which will translate into sales down the road — the market is still out of balance.

Q2 Annual Change In Home Sales

Home Prices

  • HomePrice Change Map Q2As inventory is still fairly scarce, growth in home prices continues to trend well above the long-term average. Prices in Western Washington rose 12.2% over last year to $526,398.

  • Home prices continue to trend higher across Western Washington, but the pace of growth has started to slow. This should please would-be buyers. The spring market came late but inventory growth in the expensive King County market will give buyers more choices and likely lead to a slowing down of price growth as bidding wars continue to taper.

  • When compared to the same period a year ago, price growth was strongest in Mason County, which was up 17.4%. Eleven other counties experienced double-digit price growth.

  • Mortgage rates, which had been rising significantly since the start of the year, have levelled off over the past month. I believe rising rates are likely the reason that inventory levels are rising, as would-be sellers believe that this could be the right time to cash out. That said, the slowing in rate increases has led buyers to believe that rates will not jump soon, which gives them a little more breathing room. I do not expect to see any possible slowdown in demand until mortgage rates breach the 5% mark.

Days on Market

  • The average number of days it took to sell a home dropped by seven days compared to the same quarter of 2017.

  • King County continues to be the tightest market in Western Washington, with homes taking an average of only 13 days to sell. Every county in the region other than Clallam saw the length of time it took to sell a home drop when compared to the same period a year ago.

  • Across the entire region, it took an average of 41 days to sell a home in the second quarter of this year. This is down from 48 days in the second quarter of 2017 and down by 20 days when compared to the first quarter of 2018.

  • Although we did see some inventory increases when compared to the first quarter of the year, we are essentially at the same level of homes on the market as a year ago. The market has yet to reach equilibrium and I certainly do not expect to reach that point until sometime in 2019.

Average Days On Market, Q2 2018

Conclusions

Market Speedometer

This speedometer reflects the state of the region’s real estate market using housing inventory, price gains, home sales, interest rates, and larger economic factors. For the second quarter of 2018, I have moved the needle very slightly towards buyers, but it remains firmly a seller’s market. This shift is a function of price growth tapering very slightly, as well as the expectation that we should see more homes come on the market as we move through the balance of the year.


Matthew Gardner is the Chief Economist for Windermere Real Estate, specializing in residential market analysis, commercial/industrial market analysis, financial analysis, and land use and regional economics. He is the former Principal of Gardner Economics, and has more than 30 years of professional experience both in the U.S. and U.K.


This post originally appeared on the Windermere.com Blog.

Uncategorized July 11, 2018

Local Market Update – July 2018


The local real estate market looks like it might finally be showing signs of softening, with inventory up and sales down. More sellers have opted to put their homes on the market. Inventory was up 47 percent in King County and price increases were in the single digits. Despite the increase in inventory and slowdown in sales, it’s still a solid seller’s market. Over half the properties purchased in June sold for more than list price.

Eastside

>>>Click image to view full report.

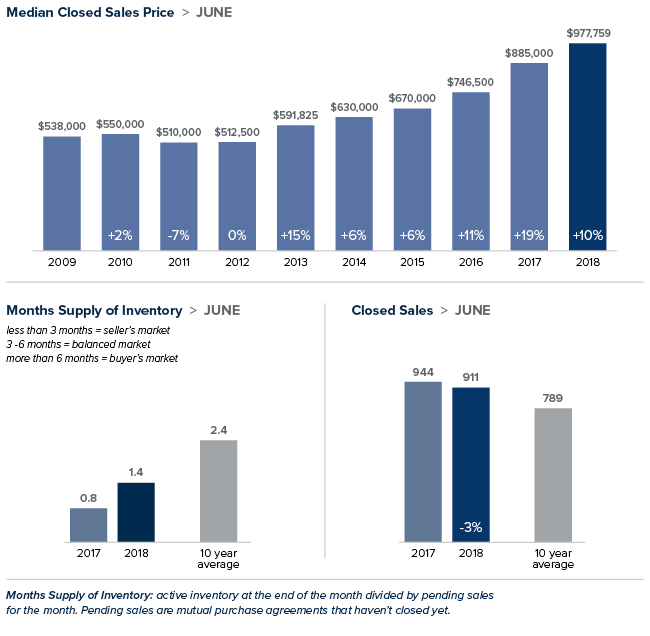
A booming economy offered little price relief for buyers looking on the Eastside. In a recent study of economic strength by state, Washington ranked number one in the country. An additional report targeting cities ranks the Seattle-Bellevue-Tacoma market as the nation’s fourth strongest economy. The median price of a single-family home on the Eastside rose 10 percent over a year ago to $977,759 setting another record. There is some good news for buyers. Inventory rose to its highest level in three years, with the number of homes for sale increasing 46 percent from the same time last year.

King County

>>>Click image to view full report.

The number of homes on the market in King County soared 47 percent from a year ago, the biggest increase since the housing bubble burst. Despite the increase, there is just over one month of available inventory, far short of the four to six months that is considered a balanced market. The median price of a single-family home increased 9 percent over last June to $715,000. That’s down 2 percent from the $726,275 median in May. Home prices haven’t dropped from May to June in King County since the last recession.

Seattle

>>>Click image to view full report.

Seattle trails only Bay Area cities when it comes to greatest profits for home sellers. That may help explain the surge in inventory in June. For example, the number of homes for sale in the popular Ballard/Green Lake area doubled from a year ago. Even though buyers are finally getting more choices, demand still exceeds supply. Homes sell faster in Seattle than in any other U.S. real estate market. That demand propelled the median price of a single-family home to $812,500; up 8 percent over last June and down from the record $830,000 set in May.

Snohomish County

>>>Click image to view full report.

The largest jump in home prices in the region came in Snohomish County. While higher-priced markets in King County are seeing increases slowing slightly, the median price of a single-family home here jumped 14 percent to $511,500, a new high for the county. Buyers willing to “keep driving until they can afford it” are finding Snohomish County an appealing destination.

This post originally appeared on the WindermereEastside.com Blog.

Community June 20, 2018

Community Service Day 2018

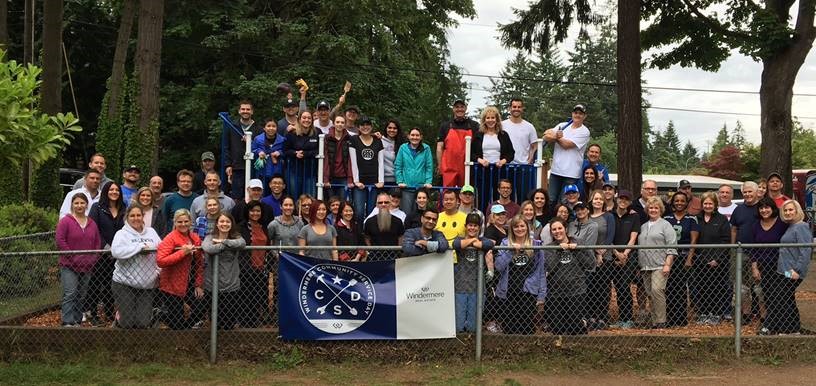
On Friday, June 8th our Windermere offices closed their doors for our annual Community Service Day. Since 1984, Windermere has dedicated a day to giving back to the community and assisting with neighborhood improvement initiatives.

We’re proud to share these projects completed by our East, Inc. offices:

Jubilee Reach

The Bellevue and Bellevue West offices teamed up to lend a hand at Jubilee REACH. This local organization supports the social and emotional needs of children and their families through mentoring, tutoring, and after-school clubs and sports programs within Bellevue public schools. Our Windermere team helped with a variety of maintenance tasks including painting doors and benches, landscaping, replacing lights, washing windows, repainting the basketball court, pressure washing walkways and play sets, and more. We are proud of our offices’ hard work at this site, and we are grateful to Jubilee REACH for their important contributions to our community and for letting us be a part of their mission!

See more photos of the day here.

Kids Without Borders

Windermere Redmond CSD 2018

Our Redmond office assisted Bellevue-based Kids Without Borders, an organization founded by Son Michael Pham, who used his experience as a refugee from Vietnam as a catalyst to serve children in our local and international communities with the vision of “all kids, one world.” Agents and staff spent the day with Son Michael Pham at the KWB storage units where they sorted and packed clothing for distribution to families in need. This was a great opportunity for us to return some of the generosity this organization has put into our global community!

See more photos of the day here.

Heritage Park

Windermere Yarrow Bay CSD 2018

Yarrow Bay agents and staff rolled up their sleeves, slipped on their gardening gloves, and grabbed shears and rakes to landscape and remove invasive plants at Heritage Park near downtown Kirkland. The park offered an incredible view of the Seattle skyline across Lake Washington as they worked – a reminder of how lucky we are to be able to enjoy the serenity of nature while still being close to the bustling city. We were happy to do our part to beautify and help preserve part of what makes our community so special!

See more photos of the day here.

Odessa Brown Children’s Clinic

Windermere Bellevue South CSD 2018

Our Bellevue South office gave back by partnering with Seattle Children’s Odessa Brown Children’s Clinic, which strives to promote quality pediatric care, family advocacy, health collaboration, mentoring, and education in a culturally relevant context. Our agents and staff helped with landscaping and mulching the clinic grounds, facilitating the book drive, and working on art projects with kids at the clinic. As an added bonus, they had the chance to listen to talks by a pediatrician and Lenny Wilkens, former NBA player and coach and current children’s healthcare advocate. We are thankful to OBCC for welcoming and inspiring us on Community Service Day and every day!

See more photos of the day here.

Cougar Mountain Zoo

Windermere Issaquah CSD 2018

Our Issaquah office headed to the Cougar Mountain Zoo in Issaquah to help with their mission to increase the understanding and appreciation of the Earth’s wildlife and the role of humanity in nature through education, conservation, propagation, and exhibition – and enjoy the company of some of its animal inhabitants. A few of their projects included clearing brush, painting benches, and habitat maintenance/wall building. This was one of the Issaquah office’s favorite Community Service Day projects, and we loved seeing them experience the zoo in a whole new way that reminded us of all of the work that goes into maintaining these neighborhood treasures!

See more photos of the day here.

https://www.facebook.com/windermereeastside/videos/1852275374793794/

Community Service Day has always been a treasured tradition and an important part of our culture here at Windermere. We greatly appreciate everything our agents invest in our communities to make them even better. Thank you all for continuing to make this a place we are proud to call HOME.

Local Market Updates June 14, 2018

Local Market Update – June 2018

Last month brought some long-awaited, positive news for buyers with May posting the most new listings in over a decade. Despite the uptick in inventory, most homes are selling in less than a month. Prices haven’t been impacted either, with the majority of the region continuing to experience double-digit home price increases.

Eastside

>>>Click image to view full report.

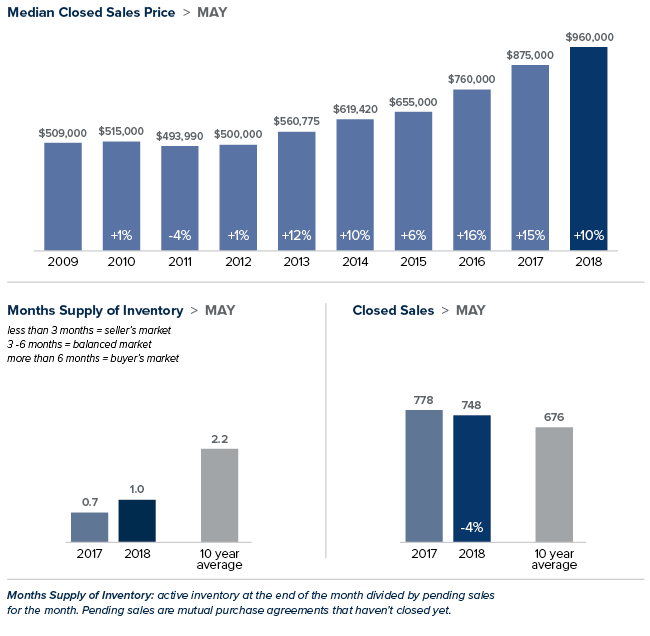
The median home price on the Eastside hit an all-time high of $960, 000 in May; a 10 percent gain over the same time last year. While there were a third more homes for sale in May than a year ago, the area still had only about a month of available inventory. Three to six months is considered a balanced market. Redmond, a city with a population of 64,000, currently has only 51 single-family homes on the market.

King County

>>>Click image to view full report.

First the good news: Those looking to buy a home in King County in May had almost 1,000 more homes to choose from compared to the previous month. The bad news: That boost in inventory did little to moderate home prices. The median price for a single-family home jumped 15 percent to $726,275, up slightly from the record high set in April.

Seattle

>>>Click image to view full report.

A strong economy and desirable lifestyle have kept Seattle a leading destination for job-seekers. The ever-increasing demand for housing has sapped supply and sent prices soaring. For 19 months Seattle has led the nation in rising home prices. May saw the city set yet another record, with the median home price jumping 14 percent to $830,000.

Snohomish County

>>>Click image to view full report.

Soaring prices in King County combined with rising interest rates make Snohomish County an affordable alternative for those willing to extend their commute time. The typical home cost $500,000 in May, an increase of 11 percent over the previous year, and down very slightly from last month.

This post originally appeared on the WindermereEastside.com Blog.